Data analysis for the Global Stocktake
The Global Stocktake has a mandate to assess countries' collective, rather than individual, progress towards the goals of the Paris Agreement and provide actionable information for increasing ambition. Global analyses that aggregate total or sectoral GHG emissions may give an indication of overall progress, but by being largely influenced by major emitters, they hide the differences that exist between countries (Nascimento et al., 2023).
Our interactive Performance Distributions Tool offers a more nuanced way to assess collective progress (Jeffery and Nascimento, 2022). A performance distribution is a histogram that groups countries based on how they fare in a specific indicator, such as greenhouse gas emissions per capita (Jeffery et al., 2021). The distribution identifies trends in the indicator and the existence of leaders and laggards. It enables peer pressure among countries and public scrutiny, which both contribute to improving ambition through the Global Stocktake process.
Explore progress on emission and energy indicators using the tool below.
How to read
The Performance Distributions Tool creates a plot with global emissions or energy indicators based on the user's selection. The plot can show data for an indicator in a given year, for the change of an indicator between two given years, and for the 5-year average annual change of an indicator in a given year. For more detail about the data sources used and the calculation methods, please download our documentation.
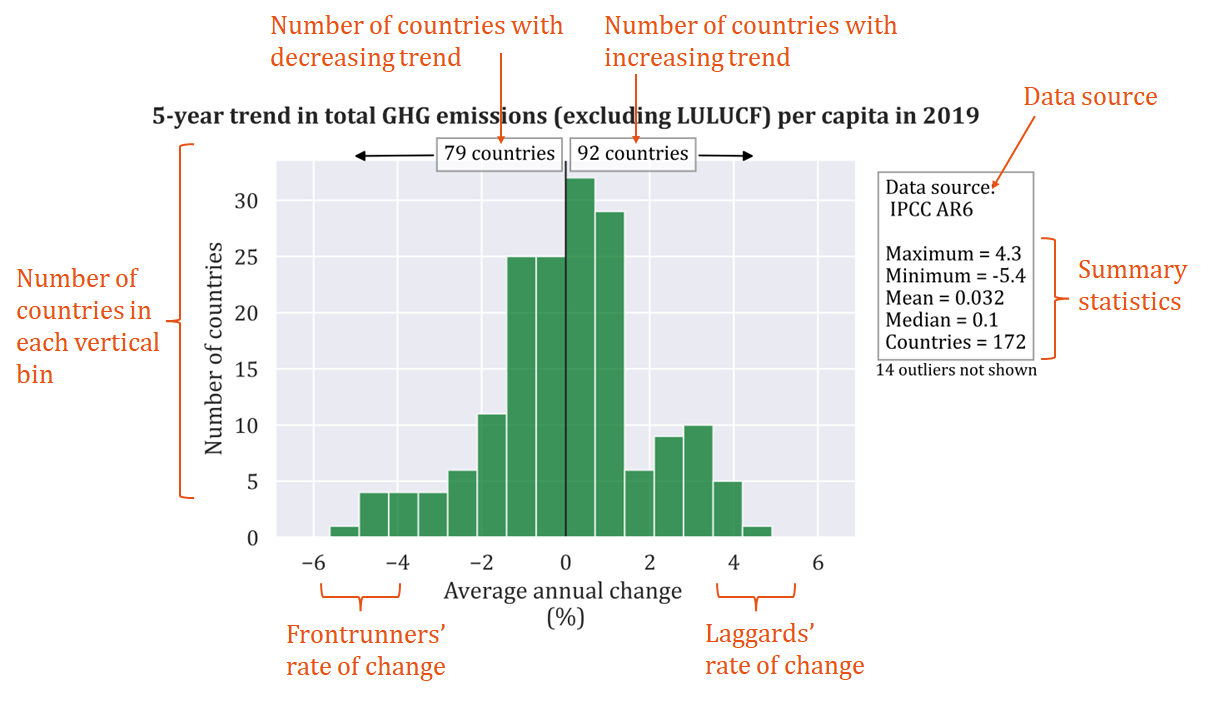
A performance distribution highlights trends in an indicator and shows how countries differ in their rate of progress. The figure below shows the 5-year trend in GHG emissions for 172 countries. The variable shown on the horizontal axis is the average annual change in the last five years. The distribution shows the following:
- Most countries had a small average annual change (less than 2%) in their total GHG emissions between 2015 and 2019.
- Most countries (92 out of 172) in the last five years had increasing GHG emissions per capita on average.
- Around 10 countries can be considered frontrunners, as they had an average yearly reduction of GHG emissions per capita of about 4% or more.
- The most successful country from the 172 included reduced its GHG emissions per capita by 5.4% annually in the last five years, while the least successful country increased its emissions by 4.3% annually in the same period.